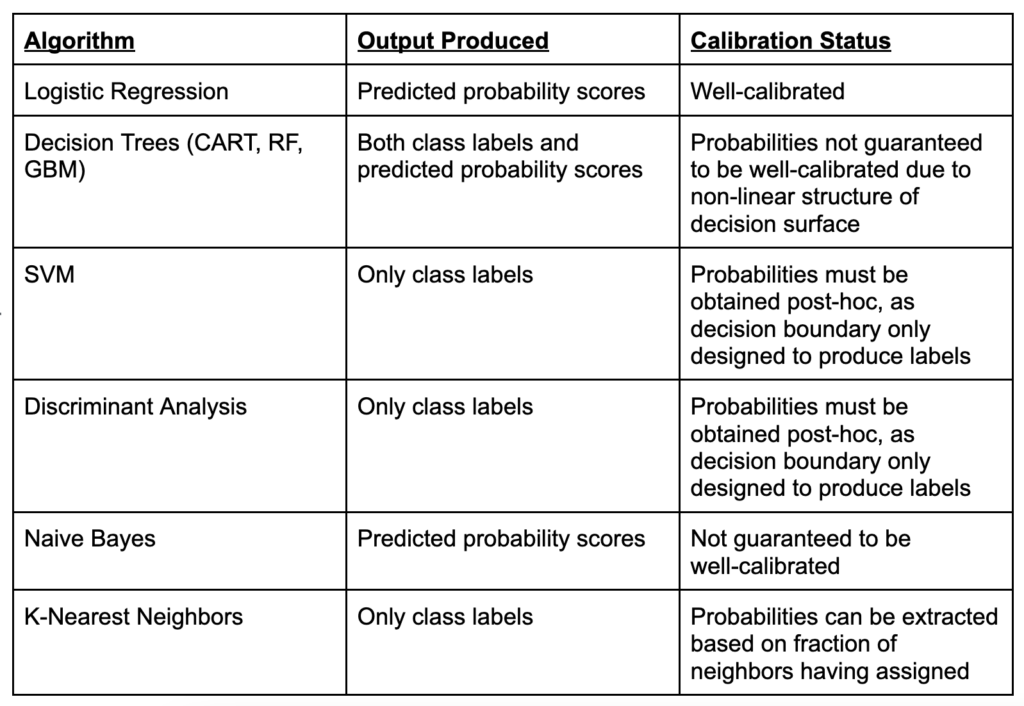
In some classification algorithms, it might be more of interest to obtain predicted probabilities of class membership rather than simply the labels themselves. For example, if a simple 0.5 decision threshold is used to assign class labels, an observation with a score of 0.51 would be converted to the 1 class in the same way as an observation with a score of 0.99. Depending on the context, it might not be wise to treat both observations with the same level of confidence, and not seeing the underlying probability score might obscure the conclusions. Some algorithms naturally produce such scores, while others are designed simply to produce class labels.
In general, Logistic Regression is the classification algorithm best designed to produce probability estimates, as it fits a sigmoid curve ranging between 0 and 1. Thus, the predicted score can be confidently interpreted as the probability of the observation belonging to the 1 class. However, in non-linear classifiers such as Decision Trees, the predicted probabilities are not guaranteed to be well-calibrated, meaning that for example a predicted score of 0.10 does not necessarily imply that the observation has a 10% chance of belonging to the positive class. Other classifiers, such as SVM or Discriminant Analysis, do not naturally produce probability estimates. The table below summarizes where the most common classification algorithms fit in regards to their predicted scores vs. class labels.

