A calibration, or reliability curve, is the standard way to assess the calibration quality of a classifier’s predictions. In order to create a calibration curve, the predicted scores are first binned into discrete intervals, such as deciles. If there are enough observations, more intervals tend to produce better plots. Within each bin, the average predicted probability of observations in that bin is plotted on the x-axis, and the overall proportion of positive labels is plotted on the y-axis.
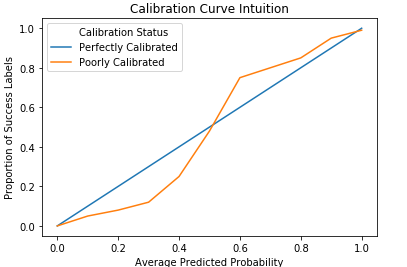
A perfectly calibrated classifier is represented by a line with a slope of 1, meaning the overall proportion of positive labels is equal to the average predicted probability within each bin. If the average predicted probability trends higher than the observed proportions, the classifier is overestimating the actual probability of success, and if the observed proportions trend higher than the average predictions, the classifier is underestimating the success probability. In the example curve below, the classifier overestimates the actual success probability in the lower deciles and underestimates it in the upper deciles.
