After confirming that the fitted model meets the assumptions necessary for linear regression, the next step of a regression analysis is usually to evaluate how well the model is performing in terms of fit and accuracy. R-Squared is one such measure.
R-squared is the classic evaluation metric in linear regression, or more precisely if there are multiple predictors, adjusted R-squared. This statistic measures the proportion of variability accounted for through the terms included in the model out of the total variability inherent in the response variable
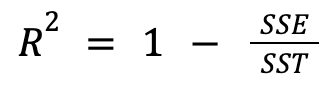
SSE: Residual Sum of Squares
SST: Total Sum of Squares
Values closer to 1 indicate that the chosen predictors are capturing the majority of variability inherent in the data, meaning the residual sum of squares (SSE) is a small fraction of the total sum of squares (SST). Values close to 0 imply that the model is doing little better than just predicting the overall mean for each observation, meaning most of the variability picked up in the model is from noise.
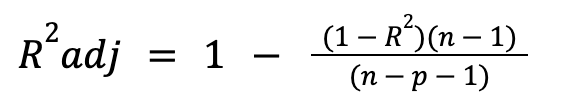
Adjusted R-squared adds a penalty for additional terms included in the model, as regular R-squared will always increase with more terms, even if they are not adding any significance. Adjusted R2 is found by :